
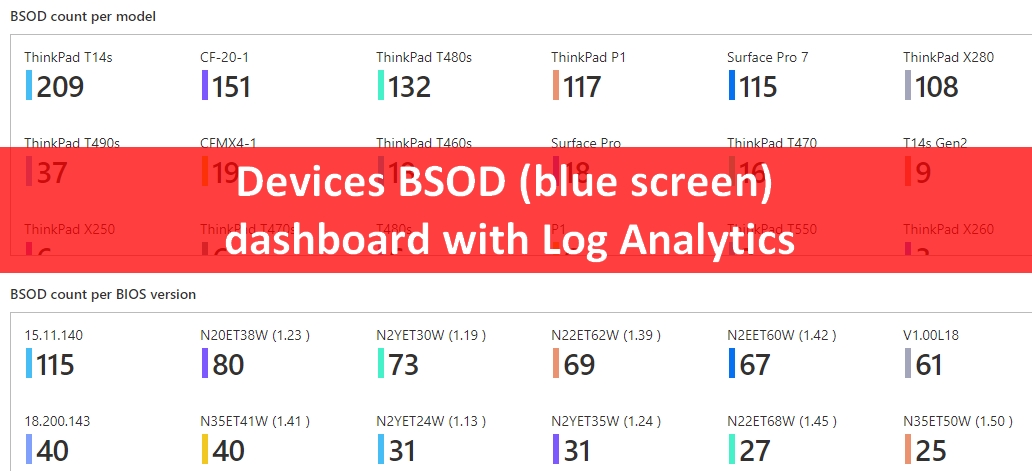
Devices BSOD (blue screen) dashboard with Log Analytics
In this post I will share with you a Log Analytics report allowing you to see all devices with BSOD during last 30 days.
What do we want ?
In the Log Analytics we want the below things:
- BSOD count per models
- BSOD count per BIOS version
- BSOD count per manufacturer
- BSOD count per OS
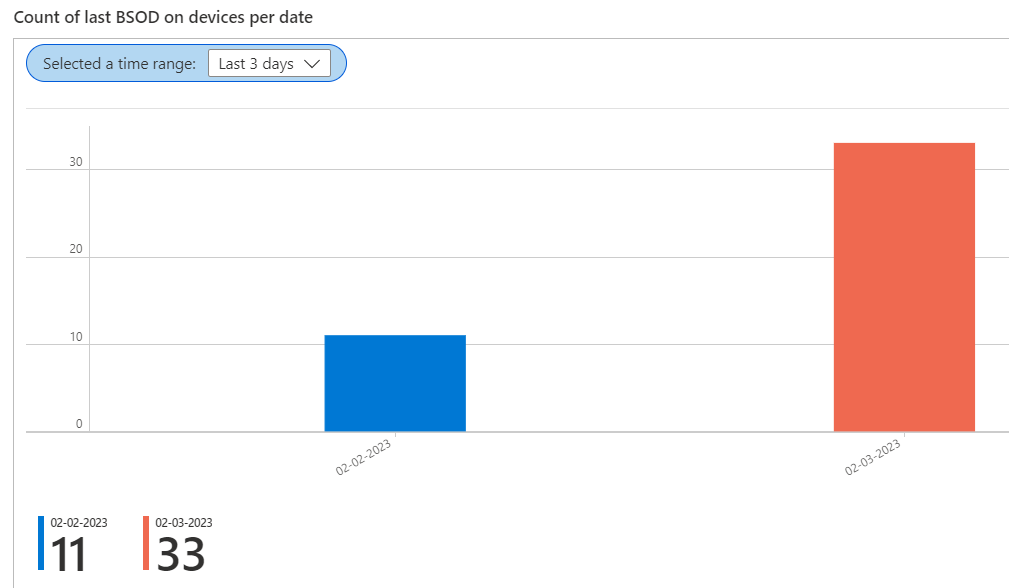
- Last BSOD count per date
- All BSOD for a specific device durng last 30 days
- Link to log of the devices (during last 15 days)
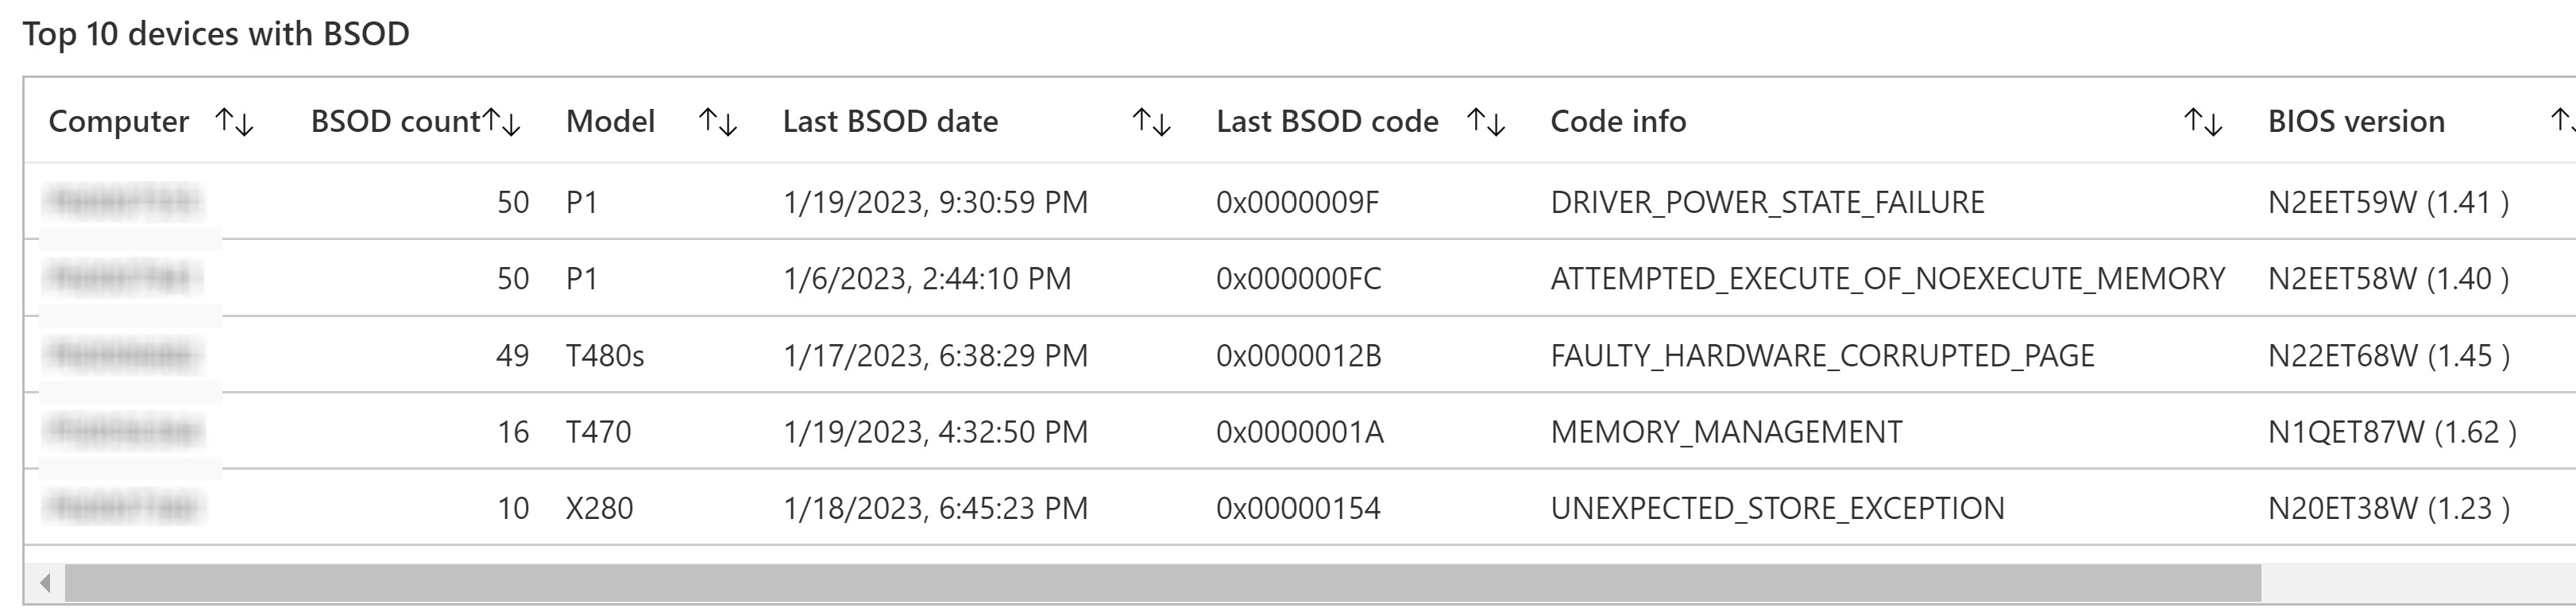
- Top 10 devices with BSOD
- Devices details
In this report you will be able to get a lot of count regarding BSOD.
You will be able to get the top 10 devices wuth BSOD during last 30 days.
The details tab will give you last BSOD date and code for each device but also all BSOD (date and code) for a specific device name.
The advantage of the solution is that you will also access to logs of each devices that has BSOD during last month.
The solution
To get the list we will use PowerShell and Azure Automation.
Check my first post here to know how to use Graph to get the result.
We will proceed as below:
1. Create a script in Azure Automation
2. The script gets devices with BSOD during
3. The script gets all BSOD for a specific device
4. The script will send data to a Custom Log
Getting BSOD devices logs
The report helps you to troubleshoot issues with devices by accessing directly to logs through the Log Analytics workbook.
Indeed for each devices with BSOD you will find a column with link to logs of the devices on SharePoint.
To get devices logs you will need to create a Proactive Remediation script that will upload logs to SharePoint when it detects a BSOD.
You can find here my previous post about this.
You will then access to below logs direclty through the report:
- All .dmp files
- Device uptime
- List of services
- List of hotfix installed
- List of drivers
- List of process
You will also get content of event log during last 15 days for the following logs:
- System
- Applications
- Security
- Kernel-Power
- Kernel-PnP/Driver Watchdog
- Kernel-PnP
- Kernel-LiveDump
- Kernel-ShimEngine
- Kernel-Boot
- Windows-Kernel-IO
How the report looks like ?
The workbook is divided in two tabs:
- Resume: displays chart with BSOD count
- Details: displays BSOD details
The first tab contains below information:
The second tab contains below information:
Resume tab
BSOD count per models

BSOD count per BIOS version

BSOD count per manufacturer
BSOD count per OS

Last BSOD count per date


BSOD count per error code

Details tab
All BSOD for a specific device during last 30 days

Link to log of the devices (during last 15 days)

Top 10 devices with BSOD
Devices details
There are also 2 filters allowing you to filter details on different things:
- Filter on device name
- Filter on models


Azure Automation account
Creating the account
1. Go to Azure
2. Go to Automation accounts
3. Click on Create
4. Type a name
5. Choose a Subscription
6. Choose the Resource group
7. Choose your region
8. Click on Create
9. Wait a bit
10. Click on Go to resource
Adding permissions
Once the Managed Identity has been configured a new Enterprise application will be created.
Then you need to add permissions to be able to actions.
The required permissions is the following:
- DeviceManagementConfiguration.Read.All
- DeviceManagementManagedDevices.Read.All
To add this permission you will need to use PowerShell, it can't be done through the portal.
For that use the script Assign_permission.ps1 on my GitHub repo.
You just need to fill below variables:
- $TenantID: your tenant ID
- $DisplayNameOfMSI: name of your automation account
Adding module
In case you want to use the Logs from device on SharePoint you'll need to add a module.
For that we will proceed as below:
1. Go to your automation account
2. Click on Modules gallery
3. Search: pnp.powershell
4. Click on pnp.powershell
5. Click on Import
6. Click on OK
Creating a Runbook
1. Go to your Automation accounts
2. Go to Runbooks
3. Click on + Create a runbook
4. Type a name
5. In Runbook type, select PowerShell
6. Click on Create
Add script in Runbook
The runbook script is located downloaded sources
Its name is: Runbook_script.ps1
Test the Runbook
1. Click on Test pane
2. Click on Start
3. Once finished, you should see Completed
Publish the Runbook
1. Go to your Runbook
2. Click on Edit
3. Click on Publish
4. Click on Yes
Schedule the Runbook
1. Go to your Runbook
2. Click on Schedules
3. Click on + Add a schedule
4. Click on Link a schedule to your runbook
5. Click on + Add a schedule
6. Type a name
7. In Recurrence, select Recuring
8. Click on Create
Log Analytics workbook
In this part we will add the report.
The report can be downloaded on GitHub.
The report is: Workbook.json
To add it, proceed as below:
1. Go to the Azure portal
2. Go to Log Analytics workspace
3. Go to workbook
4. Click on New
5. Go to Advanced editor

6. Remove content
7. Go to the GitHub link, there
8. Click on the copy button as below:
9. Click on Apply

10. Click on Done editing then Save


2 commentaires
Thanks for the insight but I have one logical question.
If the main purpose it to have information in Log Analytics, why are you pushing the logs to SharePoint first, and then go through the effort of having an Automation account to sort this information from SharePoint?
Why not build the Proactive Remediation script in a way that it automatically pushes the information directly to a Custom Log in Log Analytics, and then all you need are the Workbook queries and SharePoint becomes unnecessary.
I just use proactive remediation to get bsod logs (.dmp, evtx...) not informations of BSOD.
I get all info relative to BSOD from Intune portal and for this I use Azure Automation an Graph.
The proactive remediation just sends logs from the device to SharePoint.
Enregistrer un commentaire