
Starting with Log Analytics: Part 7 - Give your workbook a better look

In this post we will continue our series with Log Analytics and see how to make workbooks better by adding tabs, filters...
Other articles
- Part 1: Creating our first Log Analytics workspace
- Part 2: Importing your own datas into the workspace
- Part 3: Creating our first workbook
- Part 4: Add Intune datas into Log Analytics workspace
- Part 5: RunningKQL queries in Log Analytics through PowerShell
- Part 6: Creating a lab by importing a CSV with fake data
- Part 7: Give your workbook a better look (you are here)
Previous post
In the previous post, we have imported fake data into a Custom Log.
Data were located in a CSV and have been automatically integrated to Log Analytics.
The idea is to have a Custom Log with data in order to play with Workbook, KQL and queries.
Our workbook
We will create a fake BIOS update workbook.
We have the following data from our CSV :

What do we want ?
The first step is to think about what we want to display in the workbook.
We want the following things :
- A pie chart with number of devices uptodate and not
- Number of devices not uptodate per model
- A pie chart with BIOS not uptodate per days number
- Devices count with BIOS not uptodate per BIOS version
- A table with BIOS update details
- A table of 10 devices with old BIOS
- A table of devices with BIOS not uptoate
- A table of devices that have BIOS older than 2 years
Each part mentioned before can be achieved by adding queries.
Let's create it.
Adding queries
BIOS update status pie chart
The idea is to display a pie chart showing BIOS update status with two possible values :
- Uptodate
- Not uptodate
See below the expected result :

We will proceed as below:
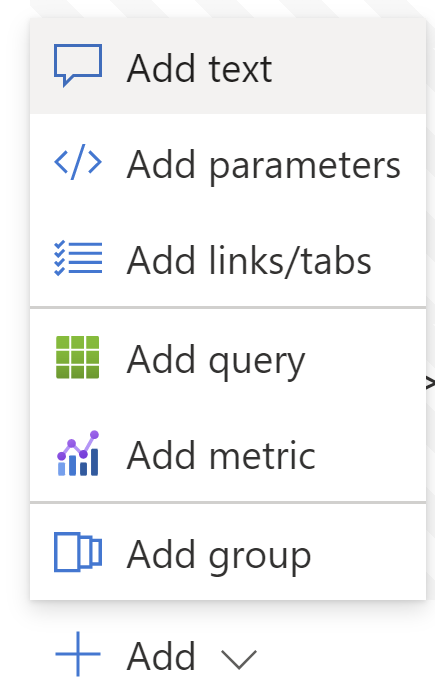
1. Click on Add > Query
2. Go to the Settings tab

3. Go to Logs Query part

4. Copy the below query
5. If you have rename custom log name or column change there here
6. Go to Visualisation

7. Select Pie Chart

8. Click on Done Editing
9. See below the result we get:

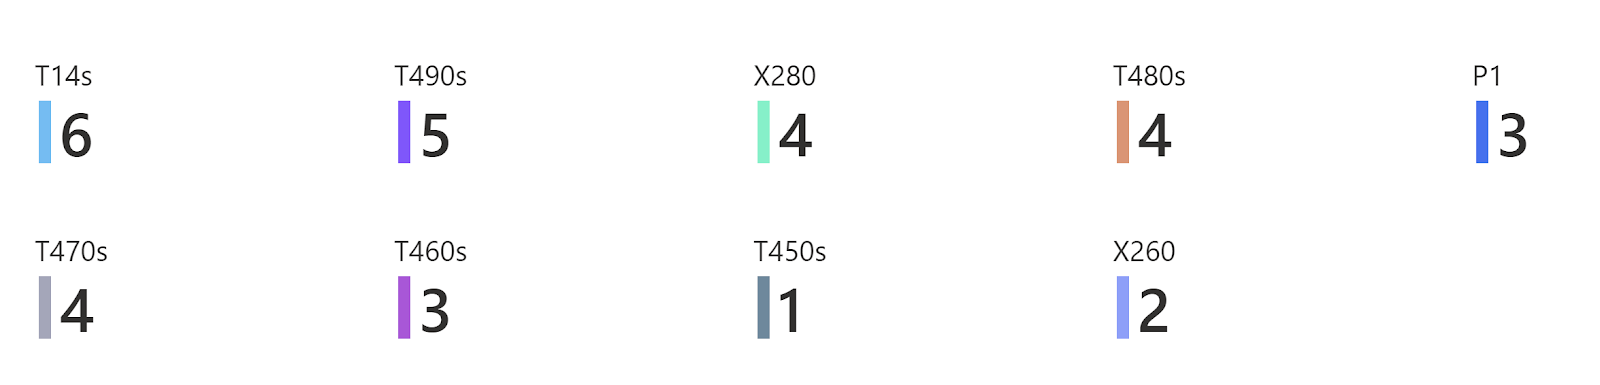
Number of devices not uptodate per model
The idea is to display a pie chart showing devices with BIOS not uptodate per model.
See below the expected result :

We will proceed as below:
1. Click on Add > Query
2. Go to the Settings tab
3. Go to Logs Query part
4. Copy the below query
5. If you have rename custom log name or column change there here
6. Go to Visualisation
7. Select Tiles

8. Click on Done Editing
9. See below result we get
Pie chart with BIOS not uptodate per days number
The idea is to display a pie chart showing number of devices with BIOS not uptodate by days, for instance we have 10 devices that have a BIOS older than 2 years or 10 devices with a BIOS older than 2 months...
See below the expected result:
We will proceed as below:
1. Click on Add > Query
2. Go to the Settings tab
3. Go to Logs Query part
4. Copy the below query
5. If you have rename custom log name or column change there here
6. Go to Visualisation
7. Select Pie Chart
8. Click on Done Editing
9. See below result we get
A table with BIOS update details
The idea is to display a table with information we have.
It's for both devices with BIOS uptodate and not uptodate.
See below the expected result:

We will proceed as below:
1. Click on Add > Query
2. Go to the Settings tab
3. Go to Logs Query
4. Copy the below query
5. If you have rename custom log name or column change there here
6. Click on Done Editing
A table of devices with BIOS not uptodate
It's the same than before but only for devices with BIOS not uptodate.
See below the expected result:

We will proceed as below:
1. Click on Add > Query
2. Go to the Settings tab
3. Go to Logs Query part
4. Copy the below query
5. If you have rename custom log name or column change there here
6. Click on Done Editing
A table of devices that have BIOS older than 2 years
We want to display a table wiyth information about devices that have BIOS not uptodate since more than 2 years.
See below the expected result :

We will proceed as below:
1. Click on Add > Query
2. Go to the Settings tab
3. Go to Logs Query part
4. Copy the below query
5. If you have rename custom log name or column change there here
6. Click on Done Editing
Now that have have added all queries let's see how looks like our workbook.

It's cool but it can be more cool.
Give your workbook a better design
We will first change all queries in order to :
- Add a title
- Add a border
- Change the main size
Configuring title, border and size
To do this we will proceed as below on each queries :
- Go on the query
- Click on Edit
- Go to Settings part

- Go to Size

- Choose Tiny

- Go to Advanced settings

- Go to Chart title

- Add a title
- Go to Style

- Check Show border around content

- Click on Done editing
Now let's check how it looks like now:

Adding search bar for table
Ok that's cool, now let's add a search bar above each table.
We will proceed as below:
1. Go to each table query
2. Click on Edit
3. Go to Advanced settings

4. Check Show filter field above grid

5. Click on Done editing
6. See below the result :

Adding some icons
Now in the table with devices info for both BIOS uptodate and not.
We have a column BIOS state, so the idea now is to replace words uptodate and notuprodate with icons.
We will proceed as below:
1. Click on Edit
2. Go to Settings
5. Click on Column settings

6. Go to BIOS state

7. Go to Column renderer

8. Select Thresholds

9. Select Icons

9. Configure it as below :

10. See below the result:

Adding tabs
Now let's go further.
We have to kind of information :
- Charts
- Table
Now we want to display them in two tabs :
- Tab overview with all pie chart
- Tab details with all table
We will first create our two tabs as below :
1. Click on Add > Adds links/tabs

2. Go to Style

3. Select Tabs

4. Go to the text field
5. Type BIOS update resume
6. Go to Action
7. Choose Set a parameter value
8. Go to Value
9. Type SelectedTab
10. Go to Settings
11. Type Resume
12. Go to the text field below
13. Type BIOS update details
14. Go to Action
15. Choose Set a parameter value
16. Go to Value
17. Type SelectedTab
18. Go to Settings
19. Type Details
20. See below result:

20. Click on Done editing
21. Click on the 3 dots
22. Click Move to top

OK, now we have two tabs but if we click on them it does nothing.
That's because we need to bind each query on the appropriate tab.
In the point 10 & 18 before we have configured a value Settings.
We have there Resume and Details.
We will add those values to our queries to bind them to the appropriate tab.
We will proceed as below :
1. Go to each query
2. Click on Edit
3. Go to Advanced settings
4. Check Make this item conditionnaly visible
5. Click on Add condition
6. In Parameter name type SelectedTab
7. Lets equals
8. Go to to Parameter value
9. Type Resume or Details depending of the query
10. Click on Save
Now if you click on Resume it will display only charts and if you click on Details if will list only tables.
As a next step we want to add some filters that will be used to filter data on all tab and not only a query.
We want for instance :
- Filter with check box to filter on models
- Dropdown menu to filter on number days old
- A text box to filter on device name
Adding filters
Filtering on models
This filter should be available for both tabs resume and details.
We will create it as below :
1. Click on Add > Add parameters
2. Click on the Add parameter button
3. In Parameter name type ComputerModel
4. In Display name type Filter on device model
5. In Parameter type choose
6. Check Allow multiple selections
7. Limit multiple selections
8. Go to the part Logs Query
9. Type below query:
10. Click on Run query
11. Go to Include in the drop down
12. Check All
13. Go to Default selected item
14. Check All
15. Click on Save
16. See below the result


Filtering on device name
2. Click on the Add parameter button
3. In Parameter name type ComputerName
4. Go to Display name
5. Type Type a device name
6. Click on Save
7. Click on Done editing
8. Go to Advanced settings
9. Check Make this item conditionally visible
10. Click on Add condition
11. In Parameter name type SelectedTab
12. In Parameter value type Details
13. Click on Save
14. Click on Done editing
15. See below the result
We have added the filter but checking or unchecking models will do nothing.
That's because we need to bind action on filter to our chart and tables.
To do this we will proceed as below :
1. Edit each Chart queries
2. Go to Settings part
3. Type below line at the end of the query:
4. Click on Done editing
5. Edit each table queries
6. Go to Settings part
7. Type below line at the end of the query:
8. Click on Done editing
9. See below result for models filtering

10. See below result for name filtering


Enregistrer un commentaire