
Intune, PowerShell and Graph API: best practices
.png)
In this article, we will cover some best practices to know in order to start automating your actions with Intune, PowerShell and Graph API.
Developer mode in browser
What is it ?
According to me, it's one the most important thing to know when you need to automate things with Intune.
The developer mode is a gold feature from your browser, Chrome or Edge allowing you to understand what is happening during a web call.
This mode can be opened by pressing F12 in your browser, which will open a configuration panel.

The idea is pretty easy, you run an action from the Intune portal and the Developer mode will show all URL, actions, API used behind.
You will then be able to see:
- URL of the resource used
- Method used
- Type of body to pass (if needed)
This is one of my favorite features that I always use when MS introduces a new feature.
To access to the developer mode, proceed as below:
1. Go to the Intune portal
2. Open the developer mode with F12
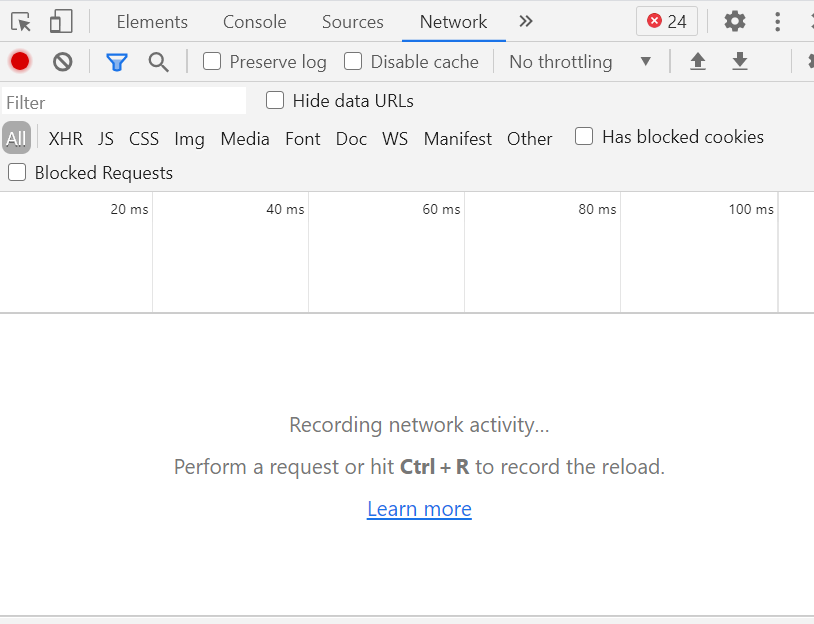
3. Go to the Network tab

4. Perform an action from the Intune portal
5. Things will appear in the main part

5. Stop recording the logs by clicking in the red button

6. Access to the Graph URL to understand what is being done
Developer mode in action
Here we will run 3 kinds of actions from the Intune portal while opening the developer mode at the same time to see the equivalence with the Graph API:
- List all devices
- Rename a device
- Restart a device
Listing devices
1. Go to Devices
2. Open the developer mode with F12

3. Go to the Network tab.
The red button indicates that the developer mode is in recording mode
4. Go to All devices.
By clicking on All devices, everything done in background will be displayed in the developer mode
5. Click on the red icon to Stop recording network log.
We want to stop recording here to avoid being overwhelmed by additional actions
6. In the developer mode, all actions performed will be displayed

7. Here we can see an action called managedDevices

8. Click on it
9. The URL of the resource to use is displayed

10. The method to use here is GET

11. A right-click allows you to copy this in PowerShell

Renaming a device
1. Select a device in Intune
2. Open the developer mode with F12
3. Go to the Network tab
4. Click on the ...
7. Click on Rename device

8. Enter a new name
9. Click on Rename

10. Click on the stop recording button
11. The resource will be displayed in dev mode
12. Click on setDeviceName, an action with a POST method
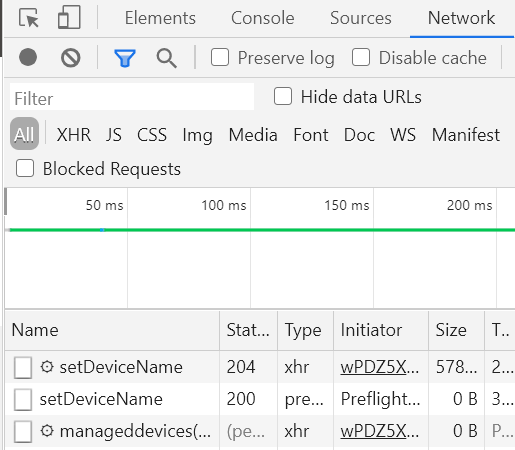
13. Click on it

14. The URL of the resource is displayed
15. The method to use is POST
16. Go to the Request Payload section
17. The JSON to use is displayed

Restarting a device
1. Go to Devices
2. Go to All devices
3. Select a device
4. Open the developer mode with F12
5. Go to the Network tab
6. Click on ...
7. Click on Restart
8. Click on Stop recording network log
9. In the dev menu, the resource is displayed
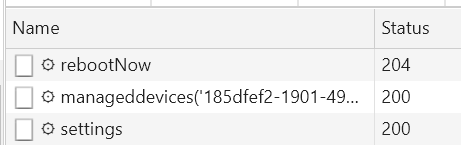
10. Here, it is rebootNow

11. Click on it
12. The path of the resource is displayed

13. The method to use is POST
Exporting query to PowerShell
The developer mode also gives a gold option allowing you to copy the query corresponding to an action to a PowerShell script.
In the below example I show how to proceed for the list devices part.
1. Do your action
2. Go to the developer mode
3. Find the good query
4. Do a right-click on it
5. Select Copy > Copy as PowerShell

Graph X-Ray
What is it?
Graph X-Ray is an awesome tool (browser extension) that helps you understand how to perform an action with Graph API and PowerShell.
This tool is developed by Merill Fernando, see here.
How to install it?
It is available as an extension:
- For Chrome: here
- For Edge: here
Or use the app from the MS Store.
In my case, I use the extension for Chrome.
Proceed as below:
1. Click on the link
2. Click on Add to Chrome
3. Click on Add extension

How to use it?
We will now perform a device listing action and see the equivalent using Graph X-ray:
1. Go to the Intune portal
2. Go to Devices
3. Activate developer mode with F12
4. Click on the >>>
5. Select Graph X Ray

6. In the Intune portal, go to All devices
7. Graph X-Ray provides:
- The resource used
- How to use it with PowerShell

8. You can then save the PowerShell as a script

Finding the right cmdlet
The first step to start playing with Graph API and PowerShell is to know which cmdlet to use.
For that we will use the Find-MgGraphCommand cmdlet included in the Microsoft.Graph.Authentication module.
For the following example we will use the RebootNow action we have seen previously.
As mentioned before, the Developer mode gaves us the following resource URL for the reboot action:
"/deviceManagement/managedDevices/{managedDeviceId}/rebootNow"
Now we will search the appropriate cmdlet.
For that type the following command:
It gives us the following result:
The cmdlet for this resource is: Restart-MgDeviceManagementManagedDeviceNow.
Now let's search all commands with a specific string.
We will search all cmdlet containg *manageddevice*.
For that we will use the following command:
Finding the right permission
Now after getting the right cmdlet we need the right permission.
You can do that using the previous cmdlet Find-MgGraphCommand, as below:
See below the result:
It gives us required permissions for the rebootNow action:
You can also get more info about the permission using the Find-MgGraphPermission cmdlet, as below:
See below the result:

You can also search info about permissions on the MS docs.
Let's use again the previous example of renaming a device.
The name of the action was setDeviceName.
Let's search "setDeviceName Graph API".
We find this page.
Permissions section indicates required permissions to perform this action:

Graph Explorer
What is it?
Graph Explorer is a web tool allowing you to make Graph API requests on your tenant.
You can then do the same thing as from the Intune portal.
Graph Explorer is available on this link
How does it look like?
Graph Explorer is organized into five sections as below:
1. Method choice
2. Graph API version choice
3. Graph resource URL
4. Body to insert in the request
5. Response of the request
Available methods
Different methods allowing you to manage a resource are available.

Below are the different methods and what they do:
- GET: Get data from a resource
- POST: Create a new resource or perform an action
- PATCH: Update a resource with new values
- PUT: Replace one resource with another
- DELETE: Delete a resource
API versions
The second drop down menu allows you to choose the API version to use.
Two versions are available: beta or 1.0

Below is an explanation of these different API versions:

Resource input
This field allows you to insert the path of the resource to act upon.
It always starts with https://graph.microsoft.com
Then add API version and resource link (beta or 1.0).
The complete link is composed as below:
Graph Link + API Version + resource link
Body and response section
The first part allows you to insert the body for creating or modifying a resource, such as the name of a device. This body must be in JSON format.
The second part displays the response of your request. The request to list managed devices will list the devices in JSON format.
Graph Explorer in action
In the following example, we will list devices in Intune.
As seen above, the resource to use is as follows: https://graph.microsoft.com/beta/deviceManagement/managedDevices
The method is GET.
Below is the response from this request from Graph Explorer:
Permissions
As mentioned previously, when you want to manage a resource using Graph API, permissions are required.
When a permission is missing, it can be visible in Graph Explorer in the Modify permissions section.


Enregistrer un commentaire