
Log Analytics v2: send custom data with PowerShell and Log Ingestion API

In this post I will show you how to send data from your Intune devices to Log Analytics v2 with Log Ingestion API.
API v1 vs API v2
API v1: HTTP Data Collector API
In my previous Log Analytics posts, I use the HTTP Data Collector API to send data to Log Analytics.
A also use this API in all my remediation scripts.
However this API is now deprecated and will be retired in 2026, see here MS doc about this.
API v2: Log Ingestion API
A new API exists to send data to Log Analytics. This one is called: Log Ingestion API.
Advantages of the Log Ingestion API solution
Supports transformations, which enable you to modify the data before it's ingested into the destination table, including filtering and data manipulation.
Lets you send data to multiple destinations.
Enables you to manage the destination table schema, including column names, and whether to add new columns to the destination table when the source data schema changes.
Prerequisites
- Log Analytics workspace where to send data
- At least contributor rights on the workspace
- Permissions to create data collection rules in the workspace
- A resource group for the data collection endpoint and DCR
What do we need ?
- Microsoft Entra application for API calls
- A data collection endpoint (DCE)
- A data collection rules (DCR)
To send custom data using the new API we need to configure a DCE and a DCR.
The DCE (data collection endpoint) is a connection used by the Logs ingestion API to send data into Azure Monitor.
The DCR (Data Collection Rule) is used to send data to a table, Custom Log.
A DCR specify for instance what data should be collected, how to transform that data, and where to send it.
When we create the DCR we need to specify the structure of the table from a JSON file.
Both DCE and DCE should be in same region as Log Analytics workspace, to receive data.
The first step is to create/configure a DCE (Data collection Endpoint).
It's used to ingest custom logs into the data ingestion pipeline.
Then Azure Monitor transforms the data and sends it to Log Analytics workspace and table based on the DCR ID.
The second step is to configure the DCR (Data Collection Rule).
For that we will create a new table (custom log (DCR based) in the Log Analytics workspace.
Create the Entra App
In this part will create an Entra app registration.
This app will be used to authenticate and send API calls to Log Analytics in order to send data.
For that we will proceed as below:
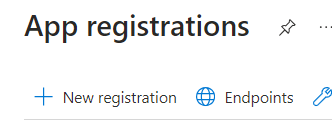
1. Go to the Entra portal
2. Go to App registration
3. Click on New registration
4. Type a name
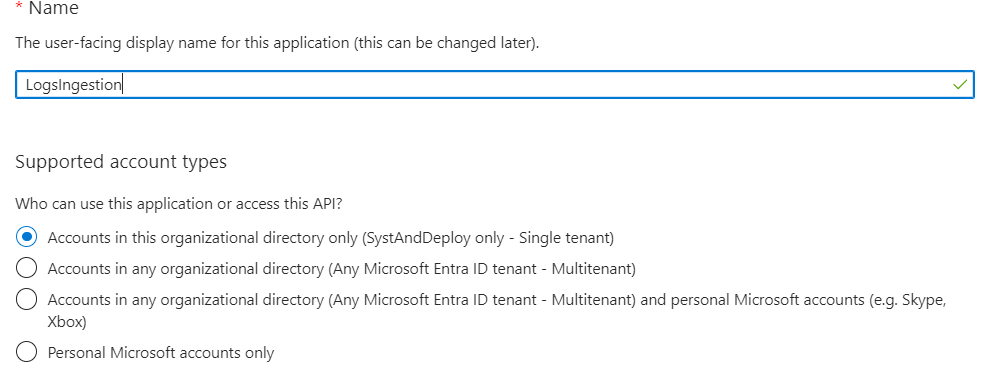
5. Let by default
6. Click on Register
7. Once created, go to Overview
8. Copy Application (client) ID

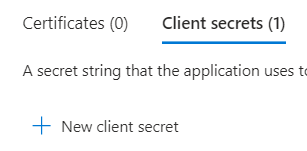
9. Go to Certificates & secrets

10. Go to Client secrets
11.Click on New client secret
12. Type a name
13. Choose a delay

14. Click on Add
15. Once created, copy the secret
Create data collection endpoint
1. Go to the Entra portal
2. Go to Monitor
3. Go to Data Collection Endpoints

4. Click on Create

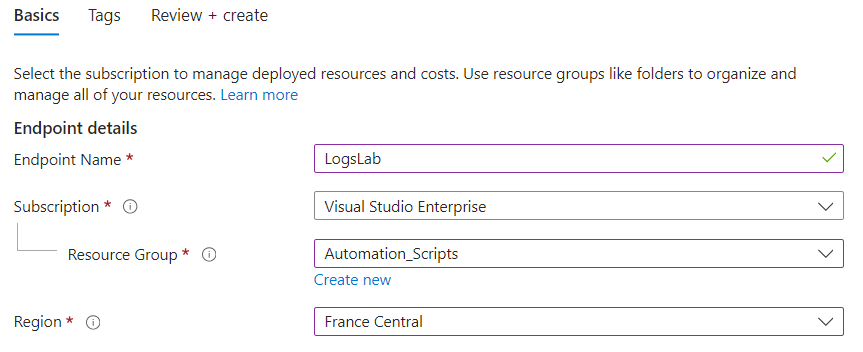
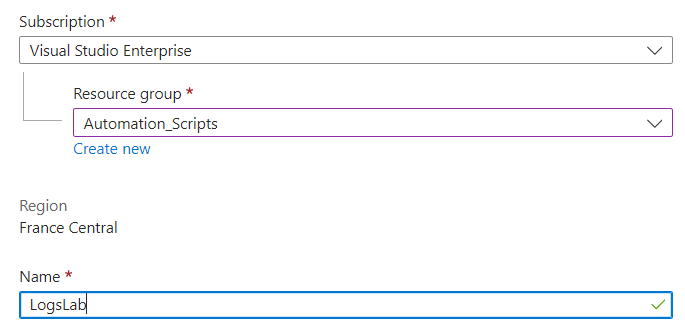
5. Type a name
6. Choose a subscription
7. Choose a resource group or create a new one
8. Choose a region
9. The region should be the same than the workspace
10. Click on Review+Create then Create
11. Once created, click on the DCE
12. Go to Overview
13. Copy the Logs Ingestion value

Prepare the data
In our example we want to collect all drivers (not Microsoft) installed on all devices.
For that will use an easy script that will get those info with WMI.
You can find this workbook on my previous post here.
See below the script:
We need now to run the code on a device and save result to a JSON file.
You can do this as below:
Create custom log (DCR)
Here we will create a new table based on a DCR.
The DCR (Data Collection Rule) is used to send data to this table.
DCRs specify for instance what data should be collected, how to transform that data, and where to send it.
When we create the DCR we need to specify the structure of the table from a JSON file.
We will proceed as below:
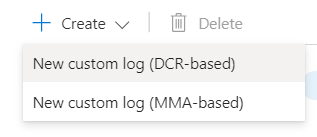
1. Go to your Log Analytics workspaces
2. Go to Tables

3. Click on Create
4. Click on New custom log (DCR based)
5. Type a name without _CL
6. Click on Create a new data collection rule

7. Choose a Subscription
8. Choose a Resource group
9. Type a Name for the DCR
10. Select the DCR

11. Click on Next
12. Click on Browse for files

13. Select the JSON file created previously

14. Click on Next then Create

15. Once created, go to Monitor
16. Go to Data collection rules

17. Go to your DCR
18. Go to Overview
19. Click on JSON View (on the right side)

20. Copy the immutableId value

Now we have the new table, our new Custom Log that will contain custom data we need to send.
You can see the structure of new table as below:
1. Go to Tables
2. Click on the new table
3. Click on the ...
4. Click Edit schema

5. You can see the columns added

Now we need to give the application permission to use the DCR.
For that proceed as below:
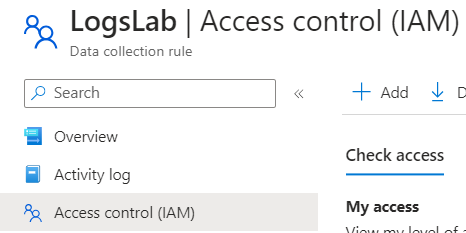
1. Go to your DCR
2. Go to Access Control (IAM)
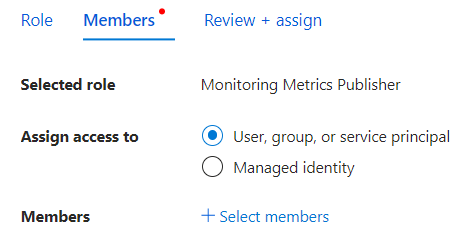
3. Click on Add role assignment

4. Check Monitoring Metrics Publisher

5. Click on Next
6. Check User, group, or service principal

7. Click on Select members
8. Search the app registration

9. Click on Select
10. Click on Review + assign
Send custom data with PowerShell
In my case, and in a log of my workbook you can find on my blog I use a Remediation script to collect data from devices and send them to a custom Log in Log Analytics.
Here in our example, we will collect all drivers (not Microsoft) installed on devices to create a Drivers inventory workbook.
You can find this workbok on my previous post here.
You can find script to use for Log Analytics v2 here.
In the script we need to specify below variables:
Now run the script.
Once it's finished go to your workspace, then go to Logs > Custom log.
You will see the new log: Drivers_Inventory_CL
Double-click on it and you will see our data.


4 commentaires
when uploading the json file,
i've had an error "there was no timestampfound in the sample proviced ...
and couldn't click "next"
i've added a line in the powershell script you provided,
=> @{label="TimeGenerated";Expression={get-date -Format "dddd MM/dd/yyyy HH:mm K"}},`
$PNPSigned_Drivers = get-ciminstance win32_PnpSignedDriver | where {($_.manufacturer -ne "microsoft") -and ($_.driverprovidername -ne "microsoft") -and`
($_.DeviceName -ne $null)} | select-object @{label="TimeGenerated";Expression={get-date -Format "dddd MM/dd/yyyy HH:mm K"}},`
@{Label="DeviceName";Expression={$env:computername}},`
@{Label="ModelFriendlyName";Expression={$Model_FriendlyName}},`
@{Label="DeviceManufacturer";Expression={$Manufacturer}},`
@{Label="Model";Expression={$Model}},`
@{Label="DriverName";Expression={$_.DeviceName}},DriverVersion,`
@{Label="DriverDate";Expression={$_.ConvertToDateTime($_.DriverDate)}},`
DeviceClass, DeviceID, manufacturer,InfName,Location
Hello,
Thanks for you article. It helps me a lot. ;-)
Regards.
This is awesome :) Do you have an example of how to authenticate the script with certificate?
Enregistrer un commentaire