
Advanced Endpoint Analytics: devices anomalies overview
In this post we will see what is Endpoint Analytics devices anomalies part and how to use it.
How to enable it ?
Microsoft recently integrated in March some cool features in Intune with some add-ons integrated in Intune suite.
One of them, called devices anomalies, is already available.
Devices anomalies is available as an add-on and is available in the part advanced Endpoint analytics.
To enable advanced Endpoint analytics you will need the Intune suite plan:
See here more info about advanced Endpoint analytics.
What is it ?
The anomalies part allows you to detect devices that have issues and works as an early warning system.
According to MS anomalies part works as below:
Anomaly detection monitors the health of devices in your organization for user experience and productivity regressions following configuration changes. When a failure occurs, Anomalies correlates relevant deployment objects to enable rapid troubleshooting, suggest root causes and remediation.
How it looks like ?
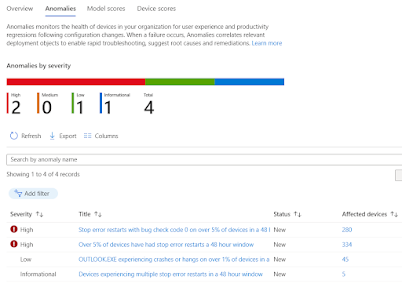
The Anomalies part looks like as below:
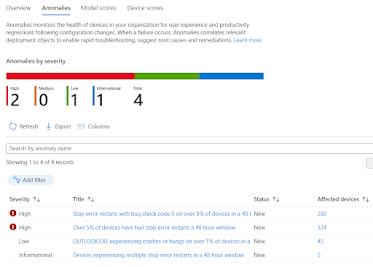
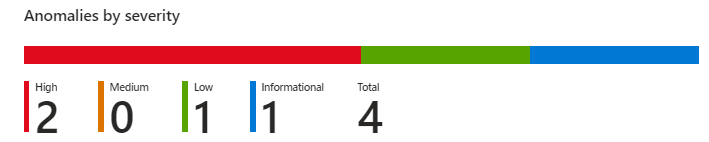
You will first see a a resume with count of anomalies on your devices by severity:
Then you will see details of anomalies:
- Severity of the anomaly (High; Low, info...)
- Anomaly title
- Count of affected devices
When you click on an anomaly you will get same info:
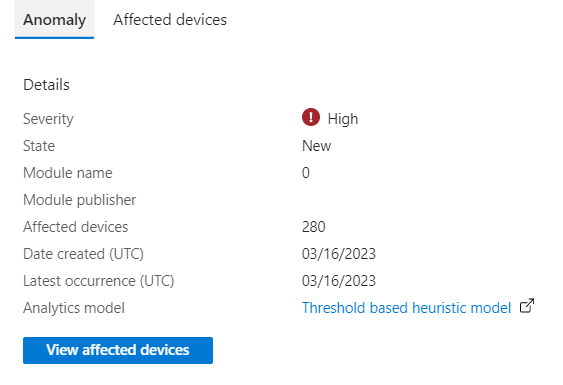
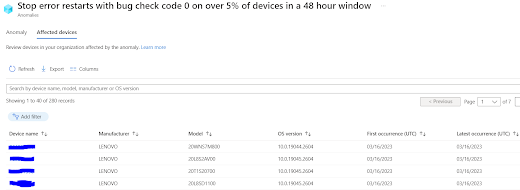
You will be able to see the list of affected devices:


1 commentaire
Cool feature, but $10 extra per month per user for extra (hard needed) features, should be illegal.
Enregistrer un commentaire